
JAMA. 2026 Jun 4:e269639. doi: 10.1001/jama.2026.9639. Online ahead of print.
Measured and Estimated Glomerular Filtration Rates and Risk of Adverse Health Outcomes
Edouard L Fu, Antoine Créon, Morgan E Grams, Josef Coresh, Arvid Sjölander, Anne-Laure Faucon, Michelle M Estrella, Friedo W Dekker, Michael G Shlipak, Lesley A Inker, Andrew S Levey, Juan-Jesus Carrero
PMID: 42240159
DOI: 10.1001/jama.2026.9639
Why was this study needed?
Let us begin with an uncomfortable truth. The entire edifice of CKD classification, the thresholds of 60, 45, 30, and 15 mL/min/1.73 m2, rests on associations between estimated GFR and adverse outcomes (Levey AS et al, Kidney Int, 2011). This is a circular argument. We use eGFR to define disease, then validate that definition by showing that eGFR predicts outcomes. The implicit assumption has always been that eGFR is a faithful proxy for true GFR, differing only by random, non-systematic error. But we have known for decades that this assumption is false.
Creatinine, the workhorse biomarker, is a byproduct of muscle metabolism influenced by a patient’s frailty, high-protein intake and/or tubular secretion. (Stevens LA et al, NEJM, 2006). Cystatin C, while more independent of muscle mass, is an acute-phase reactant potentially influenced by inflammation, obesity, smoking, and glucocorticoids (Stevens LA et al, AJKD, 2008| Russel WA et al, JASN, 2025 | also see NephJC discussions here and here). The non-GFR determinants of these markers are systematic biases that correlate with the very outcomes we are trying to predict. A patient with sarcopenia has both a falsely elevated eGFRcr and an increased risk of death, but from different causes. A patient with chronic inflammation has both a falsely depressed eGFRcys and an increased cardiovascular risk. The central question, then, is not whether eGFRcr predicts outcomes - we know it does, redundantly - but whether the risk signal we are measuring actually originates from GFR itself.
Figure 1. Density plot, and box and Whisker plot of GFR distribution, from Fu EL et al, JAMA, 2026
The study by Fu et al, simultaneously published during ERA26, breaks this circularity by anchoring risk to measured GFR (mGFR) (Fu EL et al, JAMA, 2026). Using iohexol plasma clearance - a marker that is freely filtered, neither secreted nor reabsorbed, with very low extra-renal clearance (Delanaye P et al, Clin Biochem Rev, 2016) - the authors provide the first large-scale, direct quantification of how true mGFR associates with adverse outcomes. They then ask a second, equally important question: which of our common eGFR equations most faithfully captures these mGFR-based risk associations?
How was the study done?
The investigators used the Stockholm CREAtinine Measurement (SCREAM, an homage to Edvard Munch?) project to identify 6174 adults who underwent clinical mGFR using single-sample plasma iohexol clearance. The protocol was rigorous: a 5 mL iohexol injection, timed blood sampling tailored to expected GFR (approximately 4 hours if GFR >40, 6-8 hours if GFR 15-40, and 24 hours if GFR <15), quantification via ultra-high-performance liquid chromatography with UV detection, and the Jacobsson equation for clearance calculation (eMethods- supplement 1). The analytical coefficient of variation for the iohexol method was 2.31% for a control sample at 32 mg/L and 2.04% at 65 mg/L- acceptable but not negligible.
We must be clear about what mGFR is and is not. While iohexol clearance is the best available reference method, it is not error-free. The within-person biological coefficient of variation for mGFR has been estimated at approximately 5-10% across studies (Rowe C et al, Kidney Int, 2019| Delanaye P et al, Clin Biochem Rev, 2016). The single-sample method, while practical, is less accurate than multi-sample protocols, particularly at extremes of GFR and in patients with altered extracellular fluid volumes. The supplementary materials note that patients with extensive edema or ascites were not excluded; in such patients, plasma clearance protocols can be inaccurate, and urinary clearance would be preferred. This is a limitation the authors acknowledge but cannot fully address.
The key design feature was the simultaneous measurement of serum creatinine and cystatin C, allowing direct comparison of mGFR with 3 eGFR equations: eGFRcr (CKD-EPI 2021), eGFRcys (CKD-EPI 2012), and eGFR-cys (CKD-EPI 2021). The study population (eTable2) shows that 28% had missing BMI and 21% had missing UACR, requiring multiple imputation. To note, patients with complete data had substantially lower eGFR (median 68 vs 91 mL/min/1.73 m2) and higher cystatin C (1.36 vs 1.05 mg/L) than those with missing data. They also had higher prevalence of hypertension (53% vs 25%), diabetes (27% vs 12%), and heart failure (14% vs 6%). “Missingness” was clearly not random, and patients with complete data were sicker with more advanced CKD. The imputation model, which included event indicators and the Nelson-Aalen estimator, is a best practice, but it assumes data are missing at random, a strong assumption that may not hold.
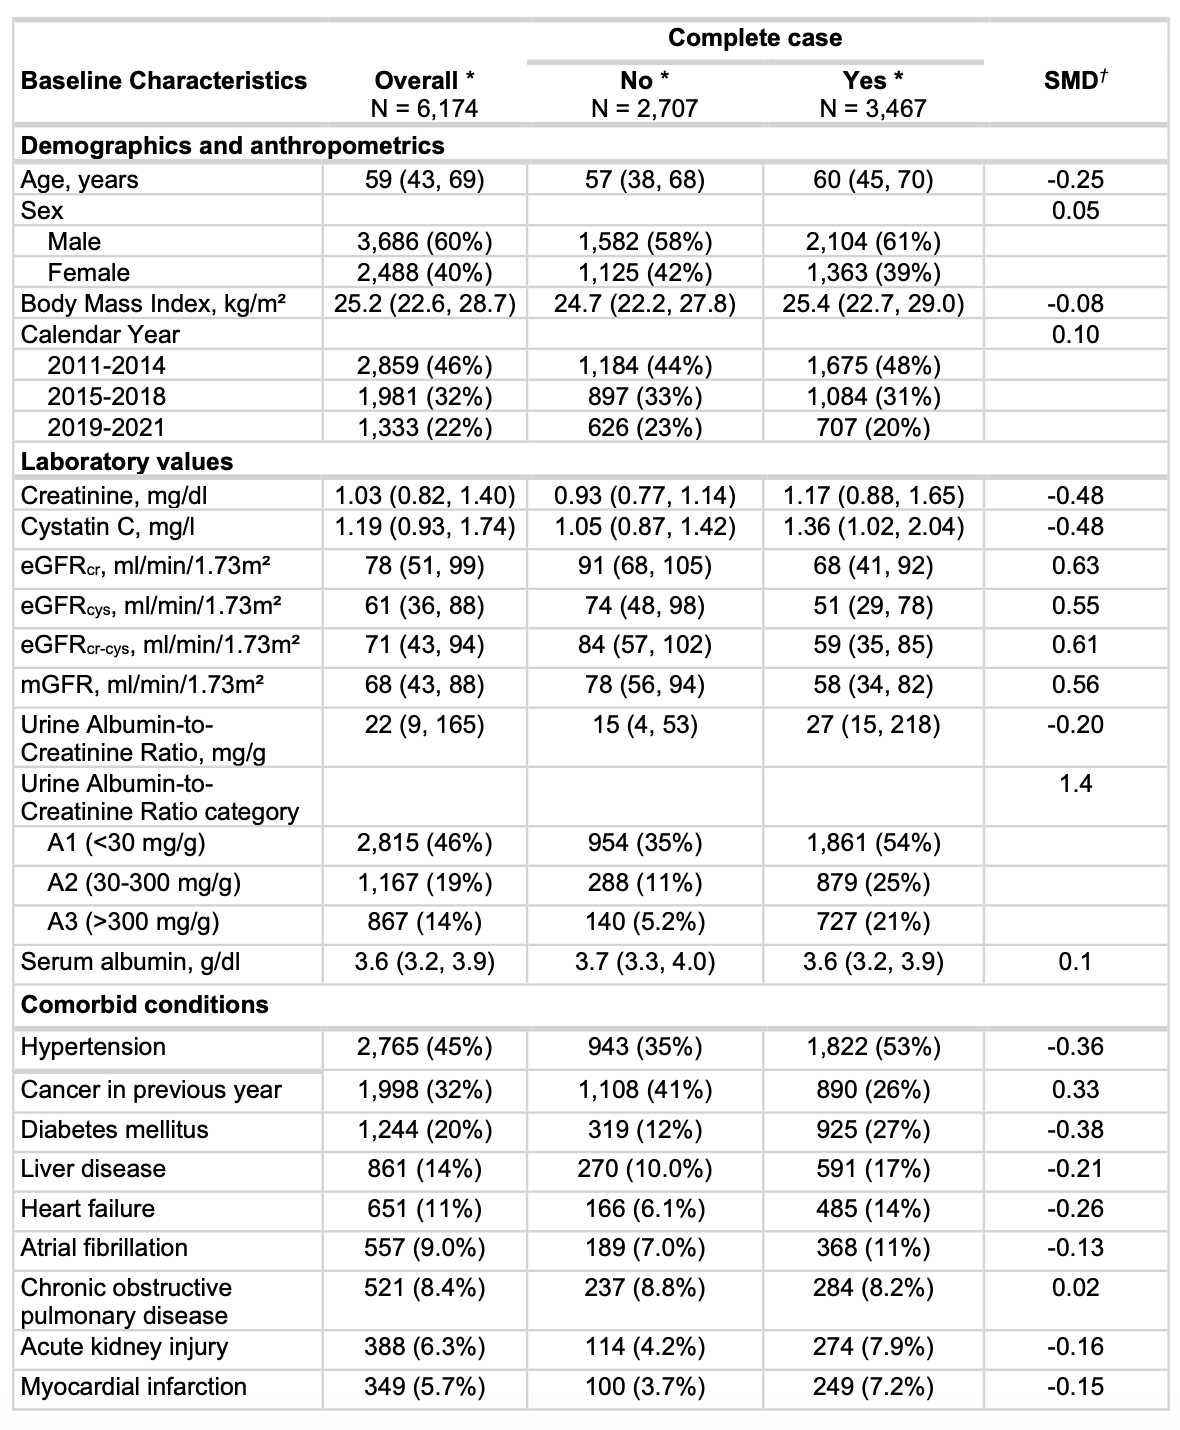
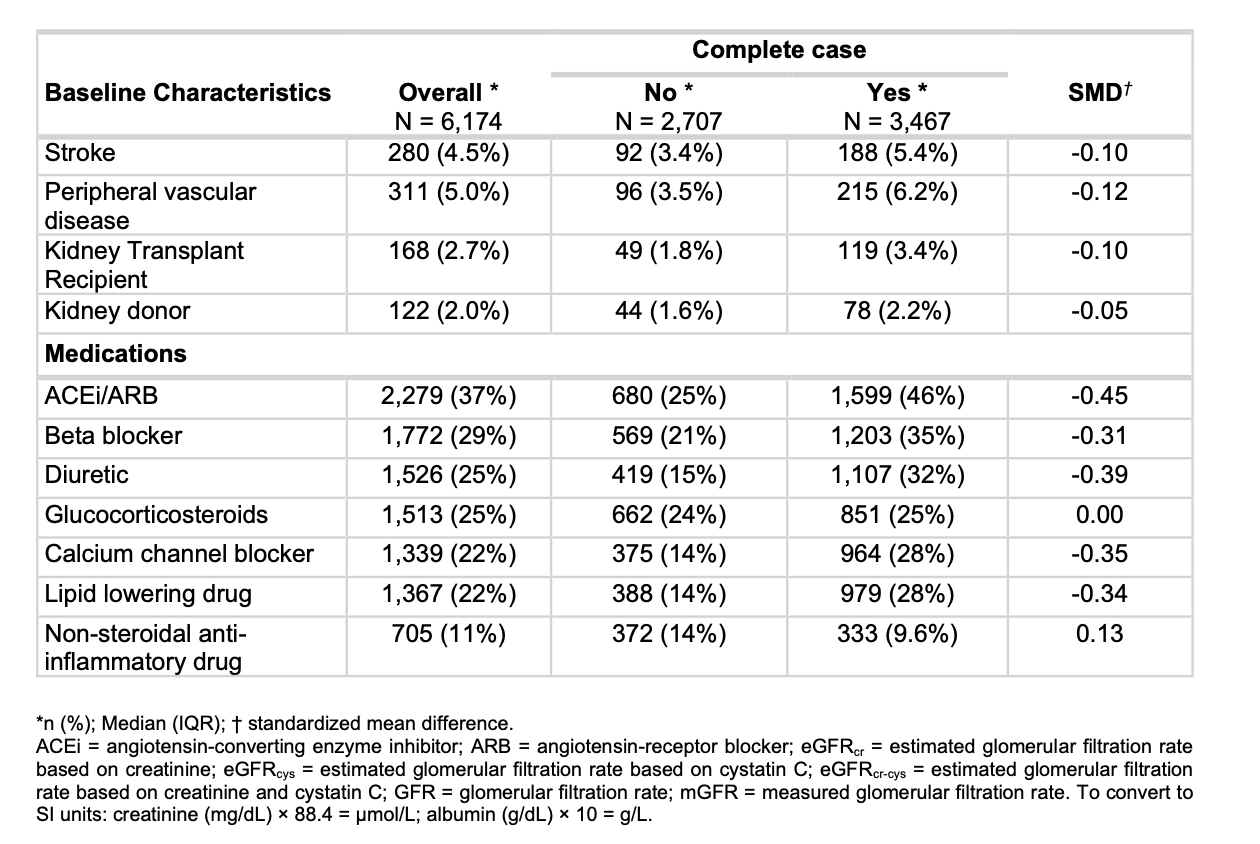
eTable 2. Baseline characteristics of persons undergoing mGFR testing using plasma clearance of iohexol in Stockholm with simultaneous creatinine and cystatin C testing during 2011-2021, with versus without missing data of UACR and body mass index, from Fu EL et al, JAMA, 2026
The authors employed Cox proportional hazard regression with restricted cubic splines to model GFR as a continuous, non-linear variable, adjusting for the covariates detailed in eTable 1. To avoid index event bias - a form of selection bias that occurs when individuals with a prior history of the outcome are included in the analysis of incident events - they correctly excluded such individuals from each outcome-specific model (eFigure1)- only applied to secondary outcomes. Additionally, to quantify the statistical uncertainty around the hazard ratios comparing eGFR, the authors used bootstrap resampling with 500 iterations, a robust and methodologically appropriate technique for constructing confidence intervals in this context.
Results
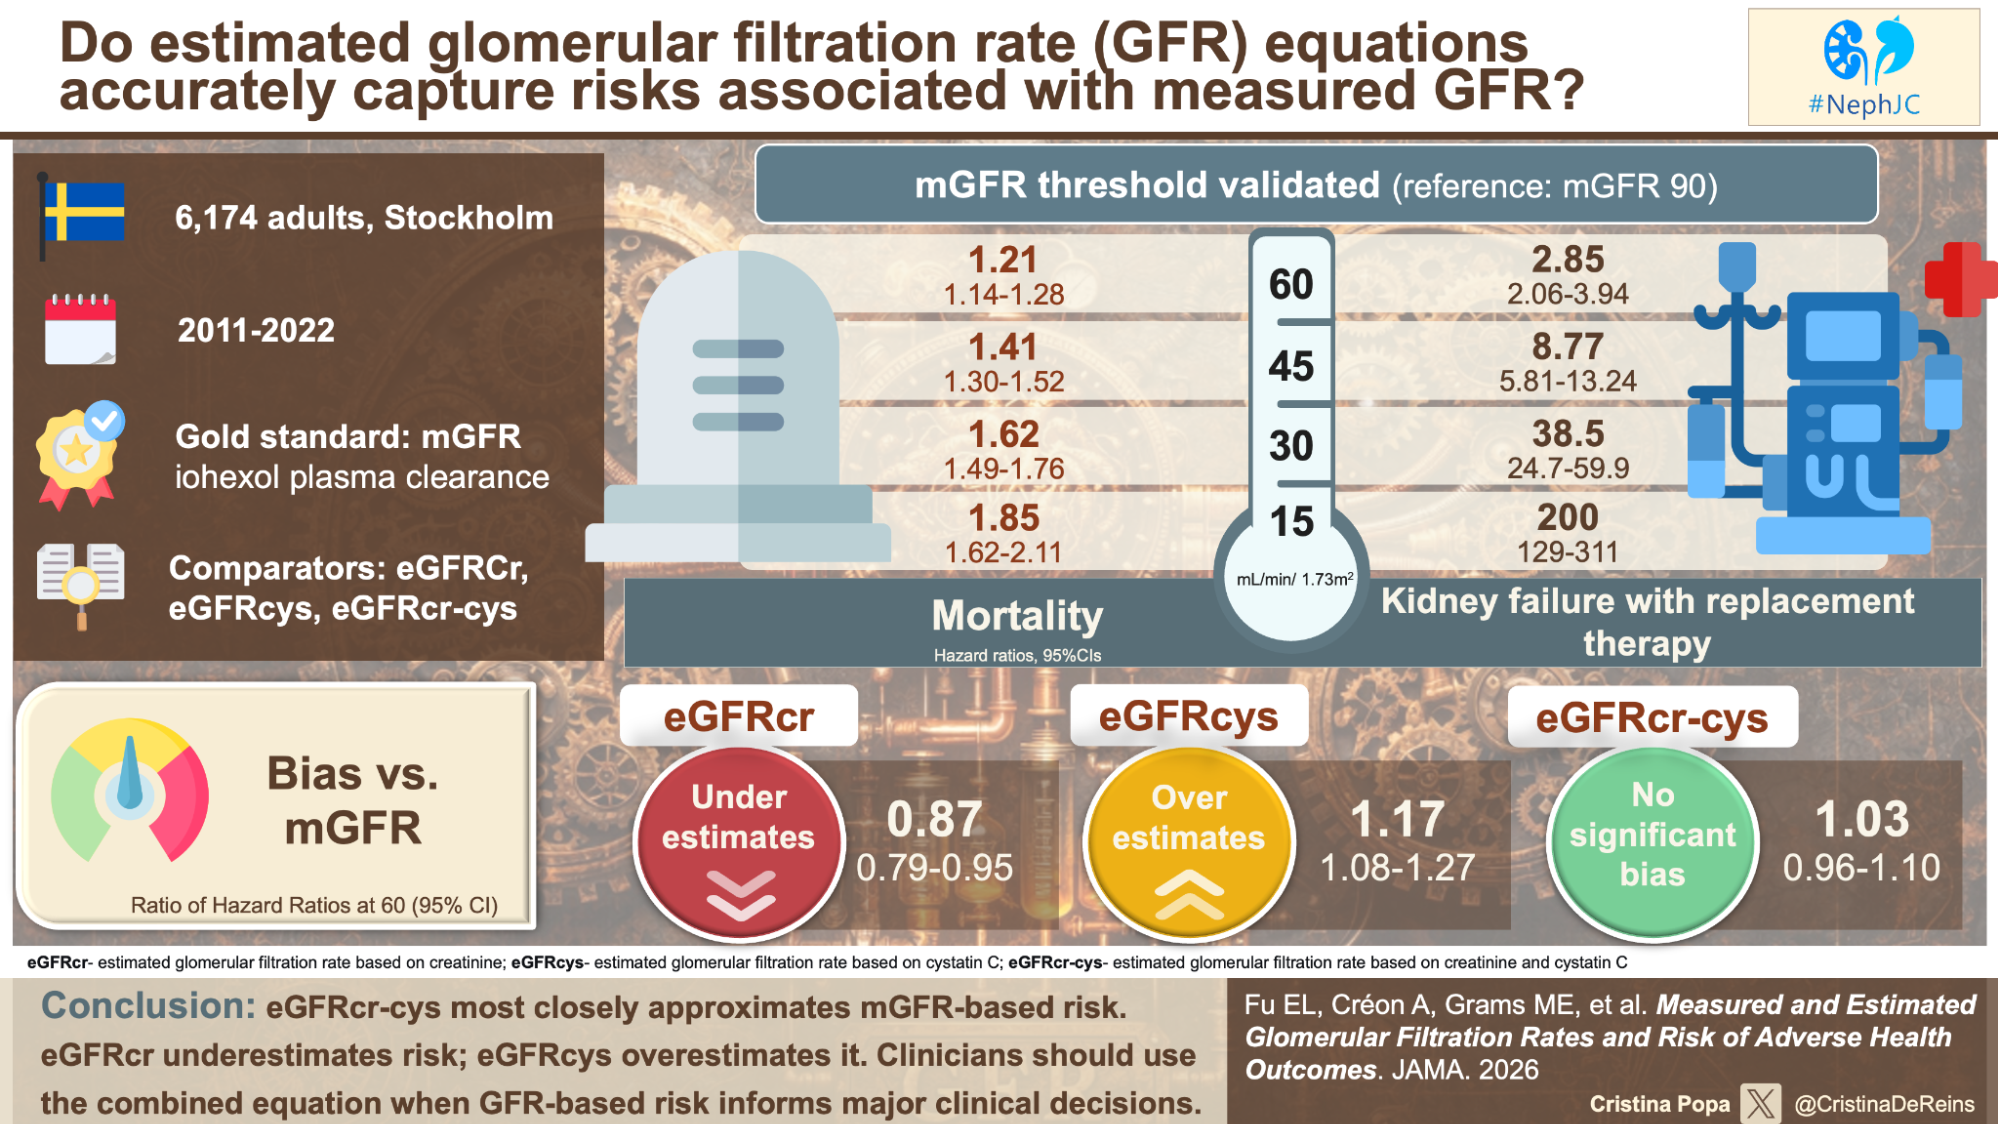
First finding: the current GFR threshold of 60 mL/min/1.73m2 was associated with significantly higher risks of both all-cause mortality (HR 1.21, 95% CI 1.14-1.28) and kidney failure requiering replacement therapy (HR 2.85, 95% CI 2.06-2.94). As measured GFR declined further, these risks increased steeply: at an mGFR of 30 mL/min/1.73m2, the hazard ratio was 38.5; at an mGFR of 15, it was 200.3. The graded, monotonic relationship between lower true GFR and higher risk is unambiguous. The heatmaps from the CKD Prognosis Consortium are not mere artifacts of estimation (Grams ME et al, JAMA, 2023). The threshold of 60 mL/min/1.73m2 holds.
Figure 2. Line graph showing the association of mGFR and eGFR with the primary and secondary outcomes, from Fu EL et al, JAMA, 2026
Below 90 mL/min/1.73m2, eGFRcr systematically underestimates mortality risk (ratio of HR at 60, 0.87, 95% CI 0.79-0.95), while eGFRcys systematically overestimates it (ratio of HR at 60, 95%CI 1.08-1.27). In contrast, eGFRcr-cys showed no significant deviation from mGFR-based risk across the entire GFR range (eFigure 4, panel A).
eFigure 4. Ratio of hazard ratios for eGFRcr, eGFRcys and eGFRcr-cys compared with mGFR for health outcomes, from Fu EL et al, JAMA, 2026
The supplementary materials add critical nuance. For kidney failure with replacement therapy, the confidence intervals for the HRs were extremely wide- for eGFRcr at 60 mL/min/1.73m2, the 95% CI ranged from 0.00 to 1.17 (eFigure 4, panel B). The authors cite limited power, but an alternative explanation is that kidney failure is a kidney-specific outcome, while mortality is influenced by systemic factors. The non-GFR determinants of creatinine and cystatin C may be less correlated with progression to kidney failure than with death.
In addition, an interesting finding can be seen in eTable 6. In the general population of 1.58 million Stockholm residents, the HR for mortality at an eGFRcr of 120 (vs 90) was 4.43 (95% CI, 4.34-4.52), more than double that observed in the mGFR cohort (2.10, 95% CI 1.76-2.50). The well-described U-shaped association between high eGFRcr and mortality was markedly attenuated in the selected mGFR cohort. Patients referred for mGFR testing- typically for drug dosing, liver cirrhosis, transplant evaluation, or eGFRcr-eGFRcys discordance- have a different risk profile than the general population. These results may not generalize to patients who would not ordinarily undergo mGFR testing.
eTable 6. Adjusted incidence rates and hazard ratios for the association of eGFRcr with all-cause mortality in the mGFR cohort versus all patients with creatinine measured in Stockholm between 2011–2021, from Fu EL et al, JAMA, 2026
eTable 11 and eFigure 10 show that including individuals with a history of heart failure substantially attenuated the HRs for eGFRcys and eGFRcr-cys. At an mGFR of 15, the HR for eGFRcys dropped from 4.25 (excluding prevalent cases, eTable 7) to 2.96 (including them, eTable 11). Patients with pre-existing heart failure, who are more likely to have elevated cystatin C from inflammation, may drive the apparent overestimation of risk by eGFRcys.
eTables 7 and 8 show consistent results using the older CKD-EPI 2009/2012 equations and the European Kidney Function Consortium (EKFC) equations. The combined equation outperformed single-marker equations across all GFR ranges, strengthening the conclusion that the principle of combining markers- not the specific coefficients of any one equation- is what matters.
How would the study change the practice?
First, eGFRcr alone is insufficient for risk stratification in patients with muscle wasting, chronic inflammation, or corticosteroid use. The bias is quantifiable: at an mGFR of 60, the mortality HR based on eGFRcr is 13% lower than the true HR. The 2024 KDIGO guidelines recommend cystatin C when greater accuracy is required (KDIGO CKD Work Group, KI, 2024). The study provides empirical justification: eGFRcr-cys is the only estimator whose risk associations are statistically indistinguishable from those of mGFR.
Second, the study reframes the race-free equation controversy. The 2021 CKD-EPI equation removed the Black race coefficient because race is a social, not biological, construct (Inker LA et al, NEJM, 2021). That decision was ethically correct. But the more fundamental problem is the use of a single, non-specific biomarker. eGFRcr-cys, which requires no race coefficient, provides the most accurate risk estimation regardless of race.
Third, the study raises a subtle question about the nature of risk. If eGFRcys overestimates risk because it captures inflammation, and inflammation is itself a true risk factor, is the overestimation truly a “bias”? For the question, “what is the patient’s prognosis?”, the discrepancy between eGFRcr and eGFRcys-low eGFRcr with normal eGFRcys suggesting muscle-wasting, or low eGFRcys with normal eGFRcr suggesting inflammation, may be prognostic in its own right.
Fourth, the study has implications for trial design. If eGFRcr underestimates risk in frail patients and eGFRcys overestimates it in inflamed patients, using either single marker as an inclusion criterion or endpoint could introduce bias. Trials using eGFRcr-cys for enrollment may achieve more homogeneous risk populations and greater statistical power.
Limitations
Several limitations temper our enthusiasm. Missing data were substantial: patients with complete data had a standardized mean difference of 0.63 for eGFRcr and 0.56 for mGFR compared to those with missing data (eTable 2). The imputation model may have been inadequate if “missingness” was related to unmeasured factors such as frailty.
The generalizability concern from eTable 6 is not trivial. The mGFR cohort was selected by clinicians. The attenuated U-shaped mortality curve at high eGFRcr suggests that healthy individuals with high eGFRcr were systematically excluded. These results may apply primarily to patients with established CKD or complex comorbidities.
eTable 10 shows that excluding kidney transplant recipients (approx. 2.7% of the cohort) did not materially change the results, which is reassuring for generalizability to non-transplant CKD populations.
Finally, the study had insufficient power to assess mGFR-related risks across albuminuria categories. Given that albuminuria is an independent and synergistic risk factor- central to the KDIGO heatmaps- this is an important gap.
Conclusion
Fu and colleagues have confirmed that our current GFR threshold of 60- derived from eGFR- holds up when tested against measured GFR. They have also shown that eGFR underestimates risk, eGFRcys overestimates it, and eGFRcr-cys corrects most of this bias. The supplement adds important caveats: the biases differ by outcome, weaken in some sensitivity analyses, and may not apply to unselected populations.
None of this means abandoning creatinine. It remains an excellent screening tool. But when the stakes are high, when a patient’s eGFR falls on the border of a major clinical decision, we owe it to them to be honest about the limits of our estimates. eGFRcr-cys is a better map, though not a perfect one. When even that is not enough for dosing highly toxic chemotherapy, evaluating living donors with discordant markers, or confirming CKD in frail patients with borderline creatinine, measured GFR remains the territory we must be willing to visit.
Reviewed by