
#NephJC Chat
Tuesday, July 22th, 2025, 9 pm Eastern on Bluesky
Am J Kidney Dis. 2025 May 13:S0272-6386(25)00859-5. doi: 10.1053/j.ajkd.2025.03.018. Online ahead of print.
Complex Etiologies of the Discordance Between Cystatin C- and Creatinine-Based Estimated GFR and Its Adverse Associations: Findings From the CRIC Study
Ian E McCoy, Jingrong Yang, Alan S Go, Hernan Rincon-Choles, Jonathan Taliercio, Sylvia E Rosas 4, Mark Unruh, Vallabh Shah, Debbie L Cohen, Jiang He, Jing Chen, James Sondheimer, Afshin Parsa, Wei Yang, Panduranga S Rao, Chi-Yuan Hsu; Chronic Renal Insufficiency Cohort (CRIC) Study Investigators
PMID: 40373998


Introduction
Sometimes estimating GFR by different serologic markers can provide markedly different results. The difference in estimated GFR by cystatin C versus creatinine has been labeled as the estimated GFR difference (eGFRdiff = eGFRcys - eGFRcr). In a systematic review of 1,489 studies (Wang et al. Kidney Med 2023), nearly 30% of participants had a discordance between eGFRcys and eGFRcr; 21% with negative differences and 9.6% with positive eGFRdiff results. Emerging data also suggest that these differences may signal underlying conditions, guide risk stratification, and predict long-term CV disease outcomes. Recognizing this, the KDIGO 2024 guidelines on CKD now recommend the use of both cystatin C and creatinine for estimated GFR determination (practice point 1.2.3.1).
Why does this discrepancy between cystatin C and creatinine eGFR occur? After all, both are endogenous filtration markers. The key lies in their biological behavior and the physiologic differences in the way the kidney handles these molecules. Creatinine (molecular weight 113 daltons), which is secreted by muscle and influenced by diet, tubular handling, and genetics, has long served as the nephrologists benchmark (i.e., part of the chemistry profile we order every morning in hospitalized patients). Cystatin C (molecular weight 13,300 Daltons) by comparison, is produced at a constant rate by all nucleated cells in the body, freely filtered at the glomerulus, and is less influenced by muscle mass, making it theoretically more accurate for measuring eGFR in selected populations. It is also recognized that other factors may contribute to eGFR disparities including chronic inflammation, endothelial dysfunction, impaired filtration of middle molecules (shrunken pore syndrome), obesity, smoking, and corticosteroid use (Yuan et al. J Am Geriatr Soc 2024).
Figure 1 from: Stehle et al, Eur J Clin Invest 2024
Figure 1 from McCoy et al, AJKD 2025
Calculating eGFRdiff appears to have clinical significance, especially in patients with advanced CKD. A more negative eGFRdiff, where eGFR based on creatinine is higher than that based on cystatin C, has been associated with increased risks of cardiovascular disease, frailty, heart failure, and mortality. For example, in a large Korean CKD cohort, patients with more negative eGFRdiff experienced significantly worse cardiovascular outcomes, and those in the highest tertile had significantly greater MACE events (Kim et al. Atherosclerosis 2021). Similarly, in a review of SPRINT trial participants, a negative eGFRdiff was associated with frailty and adverse outcomes, independent of traditional CKD measures (Potok et al. AJKD 2020). Still, many studies that have examined eGFRdiff have had significant limitations. Many were cross-sectional, lacked direct GFR measurement, and/or did not fully account for confounders such as body composition or inflammation. So the big question remains: does eGFRdiff offer independent, actionable prognostic value beyond traditional risk markers? The increasing use of Cystatin C, in an era of personalized kidney risk stratification, this investigation challenges us to rethink how we interpret filtration markers in patient care.
Methods
This is an observational study that used participants from the Chronic Renal Insufficiency Cohort (CRIC) Study, a US based multicenter, prospective cohort of adult patients with CKD that began in 2003 (Feldman et al., NIDDK Central Repository 2024). Approximately 25% of the original CRIC participants met the inclusion/exclusion criteria for this analysis.
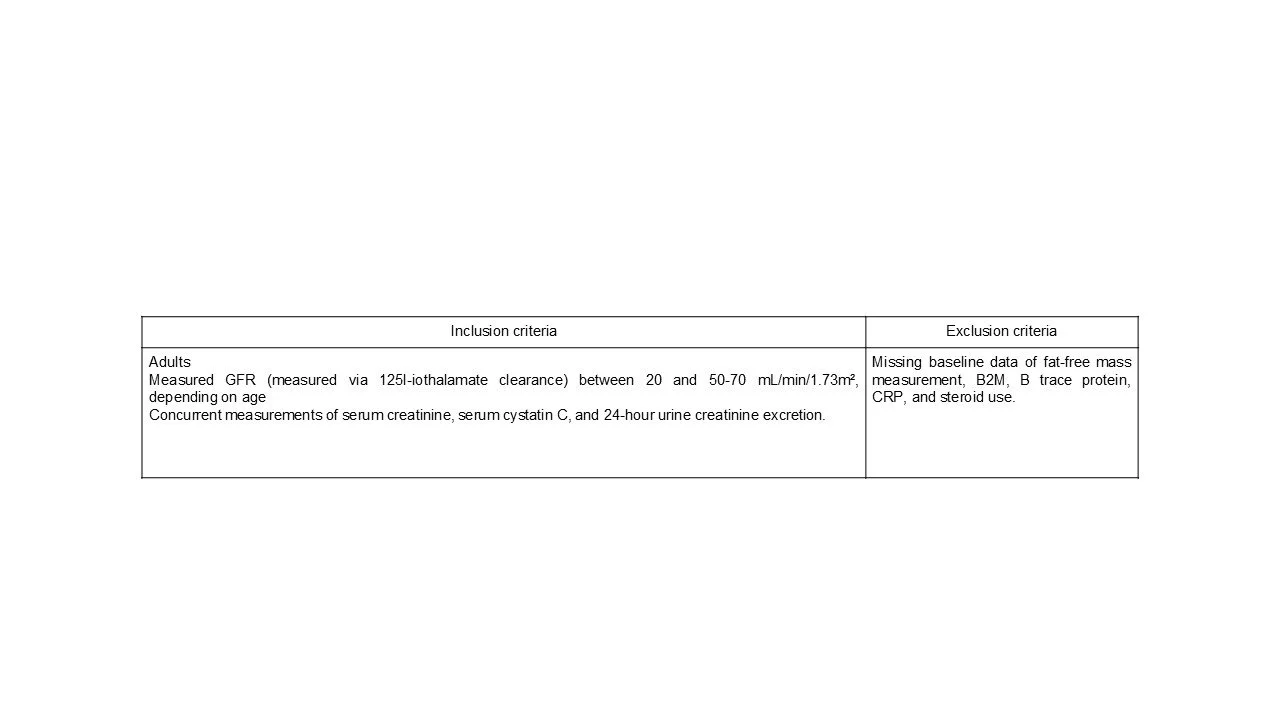
Figure S1 from McCoy et al, AJKD, 2025
Exposure: eGFRdiff
At the baseline visit, eGFRdiff was calculated as the difference between cystatin C based eGFR (eGFRcys using the 2012 CKD-EPI equation) and creatinine-based eGFR (eGFRcr using the 2021 race-free CKD-EPI equation): eGFRdiff = eGFRcys − eGFRcr.
Determinants of eGFRdiff
To explore potential contributors to eGFRdiff, several putative determinants were considered:
Sarcopenia/Creatinine production:
Urinary creatinine excretion was measured as an indicator of creatinine generation independent of GFR (unlike serum creatinine).
Fat-free mass was estimated by bioimpedance analysis and used as a proxy for muscle mass.Shrunken Pore Syndrome:
The concurrent increase in plasma levels of several proteins (β2-microglobulin, beta-trace protein and RBP), with similar molecular sizes as cystatin C, in patients with eGFRcystatin C ≤ 60% of eGFRcreatinine suggests the presence of a ‘Shrunken pore syndrome’. Measured GFR (mGFR) adjusted levels of β2-microglobulin (B2M) and β-trace protein were considered to assess shrunken pores in the study.Other biological factors:
Inflammatory status was assessed via C-reactive protein (CRP).
Steroid use, smoking status, and body mass index (BMI) were included as additional variables potentially influencing filtration markers.
Outcomes
The study assessed two primary time-to-event outcomes: (1) time to all-cause mortality and (2) time to first hospitalization for heart failure. Participants were followed from their baseline CRIC visit until the earliest of death or their final study visit. Event ascertainment was conducted through medical record review and linkage with the Social Security Death Master File.
Furthermore, the study aimed to (1) quantify the proportion of variance in eGFRdiff explained by proposed determinants (specifically, markers related to sarcopenia or reduced creatinine production, and markers suggestive of shrunken pore syndrome), (2) assess the relative contribution of each determinant to eGFRdiff, and (3) understand the underlying mechanisms.
Statistical Analysis
Two main analytic approaches were employed:
Prospective analysis:
Cox proportional hazards models were used to estimate hazard ratios for the association between eGFRdiff and time-to-event outcomes, with models adjusted and unadjusted for proposed determinants.
Cross-sectional analysis:
The variance in eGFRdiff was assessed using scatterplots and R² values.
The relative importance of each determinant was evaluated via multivariable linear regression models including all predictors.
To explore bias in each eGFR marker, univariate linear regressions were performed using the difference between estimated and measured GFR (eGFRcr − mGFR and eGFRcys − mGFR) as dependent variables.
Funding
As part of the CRIC study funding was provided through the NIDDK and NIH.
Results
The study included 1,290 participants from the CRIC cohort, who were followed for a mean duration of 13 ± 5 years. The mean age was 56 years and 44% were women. Racial distribution included 42% Black and 37% White participants. The mean eGFRcr was 47 mL/min/1.73 m² and eGFRcys was 55 mL/min/1.73 m², with a median eGFRdiff (eGFRcys – eGFRcr) of –8.5 mL/min/1.73 m², consistent with prior observations of discordance in CKD.
Age was similar across groups, with the most positive quintile being slightly younger. Gender distribution varied slightly yet in a non-significant manner, with a higher proportion of females in the positive quintile.
Participants in the most negative quintile (eGFRcys much lower than eGFRcr) had worse measured GFR (mGFR = 40.3), higher inflammation (serum CRP), higher proteinuria, and more comorbidities (diabetes, hypertension, heart failure, and cardiovascular disease). They also had higher B2M and β-trace protein levels (meaning impaired filtration of medium-sized molecules).The most negative group had slightly higher fat-free mass, although the effect size was small.
Participants in the most positive quintile (where eGFRcys exceeded eGFRcr) were younger, had higher muscle mass (reflected in higher urine creatinine), and less inflammation.
Table 1 from McCoy et al, AJKD, 2025
eGFRdiff and Clinical outcomes (Prospective analysis):
As expected, a more positive eGFRdiff was associated with lower risk of death and heart failure (aHR, 0.80 per 10 mL/ min/1.73 m2 greater eGFRdiff [95% CI, 0.74-0.88], and aHR, 0.83 [95% CI 0.73-0.94], respectively). Even when adjusted for covariates or other determinants of eGFRdiff (fat-free mass, urine creatinine, β2-microglobulin, β-trace protein), the association remained strong.
Table 2 from McCoy et al, AJKD, 2025
eGFR and muscle mass proxies (cross-sectional)
eGFRdiff was more positive in those with higher daily urinary creatinine excretion (r = 0.22, r2 = 0.05), but the correlation was weak. Fat-free mass had almost no correlation with eGFRdiff (r = −0.08, r2 = 0.006). Moreover, in multivariable regression (Table 3), daily urine creatinine excretion was associated with a positive difference (+2.3), and fat-free mass had a negative difference (−0.9), with p=0.04. Finally, a higher urinary creatinine excretion was associated with eGFRcr bias, but not eGFRcys bias.
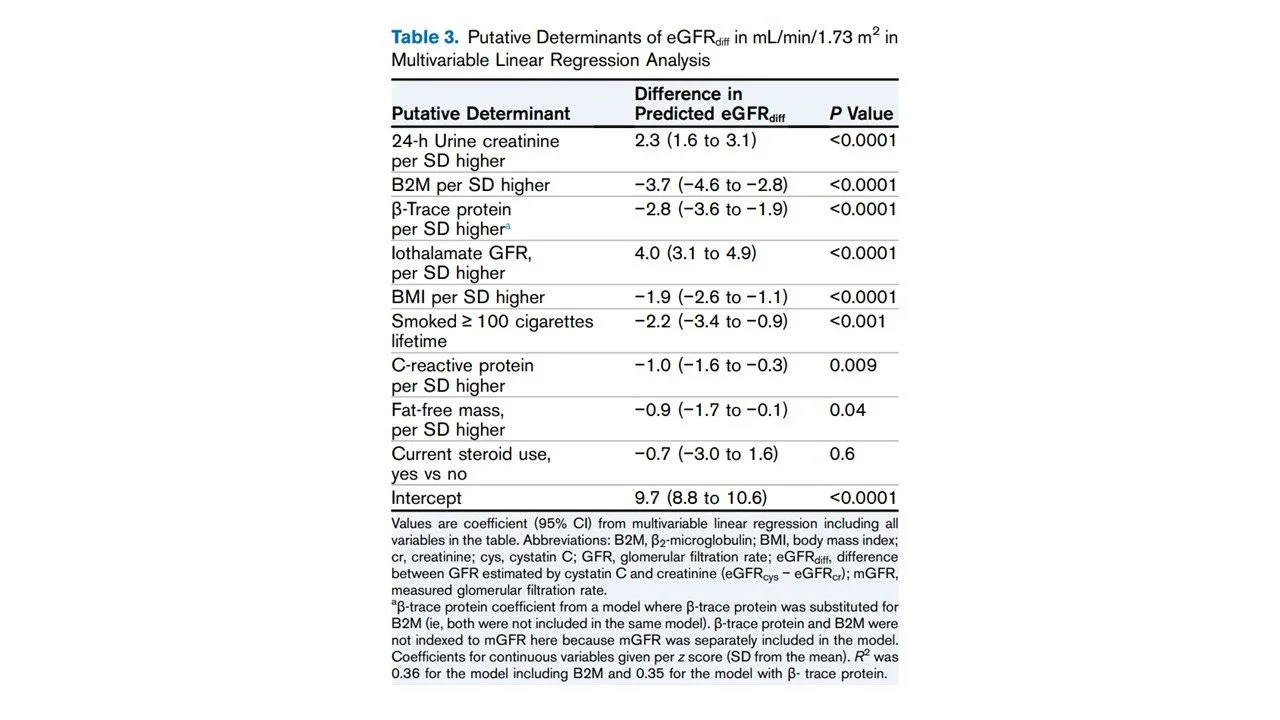
Table 3 from McCoy et al, AJKD, 2025
eGFRdiff and shrunken pore markers (cross-sectional)
Both β2-microglobulin (B2M) and β-trace protein showed very weak correlations with eGFRdiff (r = −0.11 and r = 0.15; R² = 0.01 and 0.02, respectively). In multivariable linear regression models, higher levels of B2M and β-trace protein were significantly associated with more negative eGFRdiff values: each standard deviation increase in B2M and β-trace protein was associated with a −3.7 and −2.8 mL/min/1.73 m² shift in eGFRdiff, respectively. Finally, B2M and β-trace protein levels were associated with both eGFRcr bias (overestimation) and eGFRcys bias (underestimation).
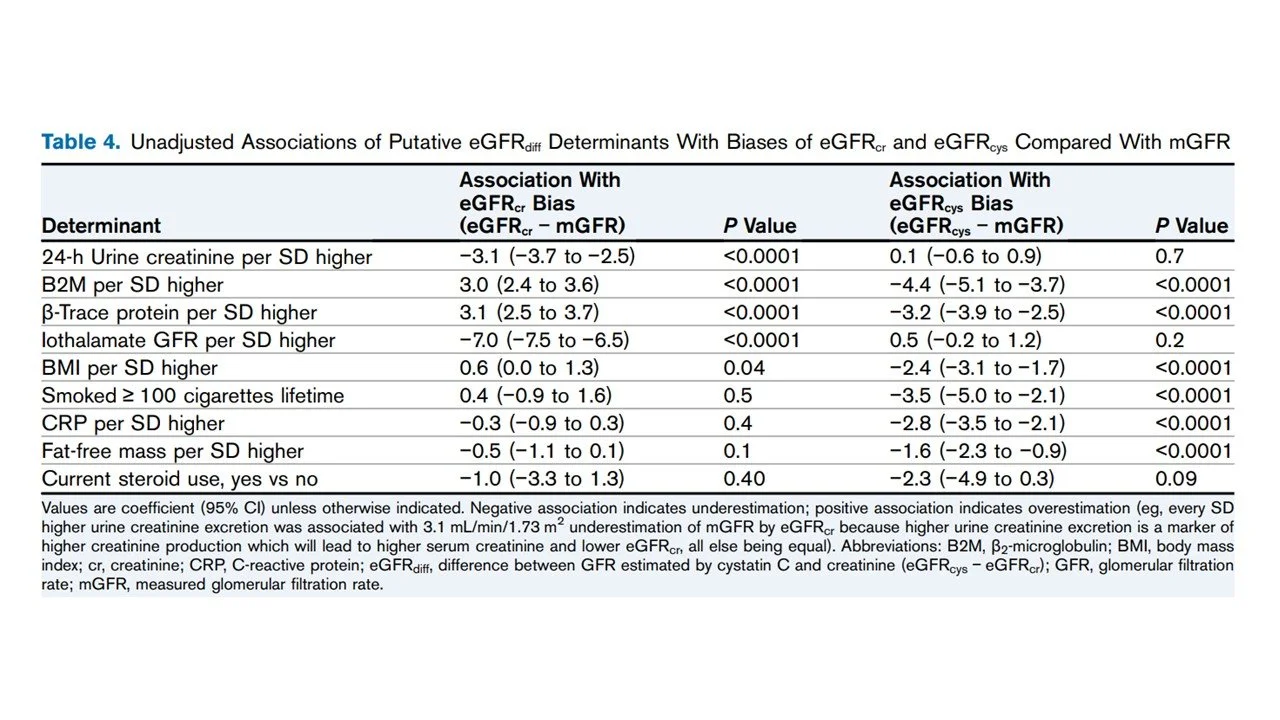
Table 4 from McCoy et al, AJKD, 2025
Combined determinants model (cross-sectional)
The linear regression model with all determinants explained only 36% of the variation in eGFRdiff (R² = 0.36). All proposed determinants were significantly associated with eGFRdiff except for steroid use (P = 0.55).
Discussion
Further evaluation of the CRIC study participants takes an important step forward in our understanding of eGFRdiff. What distinguishes this study is not novelty of concept, but the granular methodology and large cohort. This study doesn’t just note the difference between eGFRcys and eGFRcr; it rigorously interrogates its causes and also its implications using measured GFR, extensive phenotyping, and long-term outcomes. The authors demonstrate that a more negative eGFRdiff (i.e., where eGFRcr > eGFRcys) independently predicts heart failure and death, even after adjusting for mGFR, proteinuria, muscle mass, inflammation, and cardiovascular history. The signal remains consistent and reproducible, reinforcing that this discordance carries real prognostic weight.
Importantly, the study also challenges one of the most common and comfortable assumptions we make in clinical nephrology—that eGFRcr overestimates kidney function simply because of reduced muscle mass. Multiple prior studies, (Potok et al. Kidney Med 2022 and Shah et al. J Ren Nutr 2023) have shown that neither serum creatinine nor cystatin C reliably tracks with measured muscle mass or sarcopenia in older adults. The simplistic attribution of eGFRdiff to low muscle mass underperforms in clinical validation. This study adds to this skepticism by showing that the association between eGFRdiff and outcomes persists even after adjusting for body composition and direct measures of lean mass.
The sample size (n=1290) is substantial, and the cohort is richly phenotyped, with mGFR, cystatin C, and creatinine all measured under strict protocols. The availability of troponins, NT-proBNP, IL-6, and TNFRs allows for interrogation into mechanisms beyond just filtration. Most importantly, the author’s longitudinal design and adjudicated heart failure outcomes make the findings robust. The effect of eGFRdiff on heart failure and mortality held even after multivariable adjustment, which speaks to the independent prognostic value of this measurement.
There are some conceptual and clinical caveats to consider when applying eGFRdiff. This study implies that part of what eGFRdiff captures is additional pathophysiology or an aggregate signal of systemic illness, which is not mediated by kidney function and not captured by either biomarker alone. A high eGFRdiff suggests that either Creatinine/Cystatin C or both, may be incompletely adjusted for influences including inflammation, corticosteroid use, thyroid function, or endothelial dysfunction. Quantifying all these factors may be impractical and moreover likely impossible in clinical practice. So, in some sense, eGFRdiff becomes a biomarker not just of filtration but of biological reserve. This is both a strength and a limitation. It makes eGFRdiff a potentially powerful clinical signal, offering additional clinical insights but also one that is difficult to deconstruct mechanistically.
In clinical terms, this does not mean we abandon eGFRcr or begin calculating eGFRdiff at every visit. What it does mean is that when the values diverge, particularly when eGFRcr appears preserved but eGFRcys is significantly lower, that gap may be telling us something clinically relevant. This is reinforced by the observation that outcomes were worse even in those with eGFRcr above 60ml/min/1.73m2. eGFRdiff could be a window into the future where cardiovascular risk looms large for many CKD patients. The strength of this study lies not in suggesting a new equation, but in reminding us that these biomarkers are imperfect proxies.
Limitations
The study only looked at nonhospitalized patients with CKD and those with higher eGFR were excluded. Sensitive populations, like critically ill patients, could have a reason to explain the variation in eGFRdiff using sarcopenia. Most of the variance remains unexplained, highlighting the need for a thorough exploration into underlying pathophysiological phenomena. Since the findings are based on CKD patients within the CRIC cohort, generalizability to other populations (e.g., healthy individuals, patients without kidney disease and transplant patients) is uncertain. The study didn’t take measurements over time, all data points were taken at baseline.
Conclusion
This study confirms that a more negative eGFRdiff is consistently associated with higher risks of heart failure and mortality, even after adjusting for traditional risk factors. While muscle mass, inflammation, and filtration of middle molecules explain a part of the difference, much remains biologically unexplained.
Summary prepared by
Akshaya Jayachandran, Natalia Nombera Aznaran, Janany S
Summary Reviewed by
Cristina Popa, Milagros Flores, Brian Rifkin, Sayali Thakare
Header image produced by AI with prompts by Akshaya Jayachandran