
#NephJC Chat
Tuesday Aug 18 at 9 pm Eastern
Wednesday Aug 19 at 9 pm IST
Wednesday Aug 19 at 9 pm BST
Ann Intern Med. 2020 Jul 14. doi: 10.7326/M20-0529. Online ahead of print.
Conversion of Urine Protein-Creatinine Ratio or Urine Dipstick Protein to Urine Albumin-Creatinine Ratio for Use in Chronic Kidney Disease Screening and Prognosis: An Individual Participant-Based Meta-analysis
Keiichi Sumida, Girish N Nadkarni, Morgan E Grams, Yingying Sang, Shoshana H Ballew, Josef Coresh, Kunihiro Matsushita, Aditya Surapaneni, Nigel Brunskill, Steve J Chadban, Alex R Chang, Massimo Cirillo, Kenn B Daratha, Ron T Gansevoort, Amit X Garg, Licia Iacoviello, Takamasa Kayama, Tsuneo Konta, Csaba P Kovesdy, James Lash, Brian J Lee, Rupert W Major, Marie Metzger, Katsuyuki Miura, David M J Naimark, Robert G Nelson, Simon Sawhney, Nikita Stempniewicz, Mila Tang, Raymond R Townsend, Jamie P Traynor, José M Valdivielso, Jack Wetzels, Kevan R Polkinghorne, Hiddo J L Heerspink
PMID: 32658569
Editorial from Harrison and Hemmelgarn


Introduction
Richard Bright is usually credited with establishing proteinuria as a hallmark of dropsy, but many others, including Paracelsus and Dekkers in the 16th and 17th century had noted the coagulable nature of urine in some patients (Cameron, NDT 2003). Bright, needless to say, deserves the credit for putting dropsy, coagulable urine and alterations in the kidneys all together in his treatise (see Boss, Bristol Med Chir J 1978). Fast forward a few centuries and even tiny amounts of albuminuria in diabetes predicted subsequent proteinuria and kidney disease (Mogensen, NEJM 1984). Similar findings soon followed in patients without diabetes (Gerstein et al, JAMA 2001). Now, we know that albuminuria is not only a marker of kidney disease, it is associated with all-cause mortality, kidney disease progression, kidney failure and cardiovascular related deaths (Levey et al, AJKD 2019). Albuminuria, rather than proteinuria is now considered the gold standard for quantifying urine protein, given the findings from these and many more epidemiological studies and clinical trials. This has lead to albuminuria being incorporated into the definition and staging of CKD.

The KDIGO clinical practice guidelines recommend screening for, and monitoring of, albuminuria. Moreover, albuminuria is utilized in a myriad of predictive models for the development of kidney failure, cardiovascular outcomes, and timing of other clinical outcomes. The Kidney failure risk equation (KFRE) is a validated tool utilized to predict kidney failure, which incorporates urine albumin:creatinine ratio (ACR), sex, age and estimated glomerular filtration rate (eGFR) (Tangri et al, JAMA 2011). To this end, the laboratory assay for albuminuria is being standardized for widespread use.
Unfortunately, urinary albumin reagent cost and nephrologic practice tradition has hindered the widespread adoption of urine albumin measurements. Instead, non-standardized and less precise measurements like urine protein:creatinine ratio (PCR) and urinary dipstick are substituted. In theory, total proteinuria includes albuminuria and non-albumin proteinuria. In some conditions (eg light chains and myeloma) the non-albumin proteinuria may predominate, but these are exceptions. Usually albumin is the largest contributor to proteinuria. Due to cost or resource restraints, PCR and urine dipstick measurements are often the only available assays for proteinuria. For this reason, KDIGO provides recommendations for albumin measurements that are not available where PCR or urine reagent strip results may be substituted, as depicted below.
Despite these recommendations, the diagnostic performance and consistency of PCR and urine protein dipstick serving as a surrogate for albuminuria has not been evaluated. However, this necessitates the evaluation of PCR and urine dipstick as ACR surrogates. This leads to the present study, which sought to develop equations converting PCR and urinary protein measurements into ‘predicted ACR’, and subsequently evaluating diagnostic accuracy in CKD screening and staging.
The Study
Design
Individual participant-based meta-analysis involving cohorts participating in The Chronic Kidney Disease Prognosis Consortium (CKD-PC), a world-wide consortium, comparing predictive ACR values derived from PCR or urine dipstick measurements with measured ACR values. Includes cohorts worldwide with a total of 33 cohorts and 919,383 participants.
Study population
Inclusion criteria:
> 18 years old
Cohort required at least 200 participants
Measure of ACR and PCR or dipstick occurred on the same day
Contained full range of ACR values (<300mg/g and ≥300mg/g).
Procedures
Methods of urine collection varied by cohort. There was a mix of morning spot, random spot and 24-hour collections.
Model Development
In order to evaluate correlations between PCR, urine dipstick, and ACR, multivariable-adjusted linear regression models were used. Relationships were visually depicted to demonstrate intercohort variation. Due to minimal variability, a multivariate random-effects meta-analysis was performed. Similar procedures were followed for urine dipstick. In the sensitivity analysis, associations between measures of urine samples collected within 90 days of each other were evaluated.
Model testing
Equations were derived to convert PCR and urine dipstick measurements, predicting levels of ACR (Table 2). The predicted levels of ACR were calculated on the basis of crude and adjusted models for all combinations of sex, diabetes and hypertension.
Table 2 from Sumida et al, Annals of IM 2020
To assess the real world utility of the prediction equations, the sensitivity, specificity and positive and negative predictive values of PCR and urine protein dipstick thresholds for screening CKD (ACR ≥30mg/g) and CKD staging of A1 (ACR 30-299mg/g) and A3 (ACR ≥300mg/g) was evaluated. For the crude model PCR calculation, a single threshold for all participants was used. For the adjusted model PCR calculation, the threshold was varied to be the PCR level corresponding to the predicted ACR of 30-300mg/g for each combination of sex, diabetes, and hypertension. Similar methods were used for the urine protein dipstick. The predicted ACR from ‘trace and greater’ urine protein dipstick was utilized to evaluate CKD screening performance. The predicted ACR from the ‘trace to +’ and ‘++’ urine protein dipstick was utilized to evaluate A2 and A3 CKD staging performance, respectively.
Sensitivity and specificities were meta-analyzed to fit a 2-level mixed logistic regression. Analysis were also performed on subgroups of sex, eGFR, diabetes and hypertension.
For those with eGFR <60mL/min/1.73m², the 2-year Kidney failure risk equation (KFRE) was plotted using the predicted ACR vs the equation using the measured ACR. Sensitivity, specificity, and positive and negative predictive values were performed separately in cohorts sending data to the Data Coordinating Center and in the 12 Optum Labs Data Warehouse (OLDW) cohorts (one of the large cohorts participating in the CKD-PC) for external validation.
Results
A total of 33 cohorts with 919,383 participants met eligibility. Of the 33 cohorts, 12 were research cohorts (n = 36,592) and 21 clinical cohorts (n = 188,791). Data was collected between 1982 and 2019. The mean age was 61 years, 50% of participants were female, 4.8% were black, 56% had diabetes and 72% had hypertension. Median ACR was 14mg/g, median PCR 197mg/g. Of the urine dipsticks, 7% indicated trace proteins, 3.9% +, 1.8% ++ and 2.2% >++ (Table 1).
Table 1 from Sumida et al, Annals of IM 2020
Relationships between PCR and ACR and between urine dipstick and ACR: A nearly linear correlation between PCR and ACR was observed above a PCR measurement of 50mg/g. There was, however, a shallower slope for values of PCR >500mg/g compared to those between 50-500mg/g. Below PCR of 50mg/g, little to no correlation was observed. The effects of all combinations of sex, diabetes and hypertension were relatively small.
Figure from Sumida et al, Annals of IM 2020
A graded relationship between urine dipstick protein categories and ACR, with some heterogeneity between cohorts, was observed. Again, relatively small effects were observed with all combinations of sex, diabetes and hypertension in the adjusted model.
Prediction Model Performance: In the crude model, the predicted ACR levels corresponding to PCRs of 150mg/g and 500mg/g were 33mg/g and 220mg/g, respectively. Thresholds of the PCR levels corresponding to predicted ACR of 30mg/g and 300mg/g were 142mg/g and 660mg/g, respectively (Table 3). The predicted values of ACR for trace, +, ++, and >++ were 25mg/g, 67mg/g and 337mgmg and 1229mg/g, respectively.
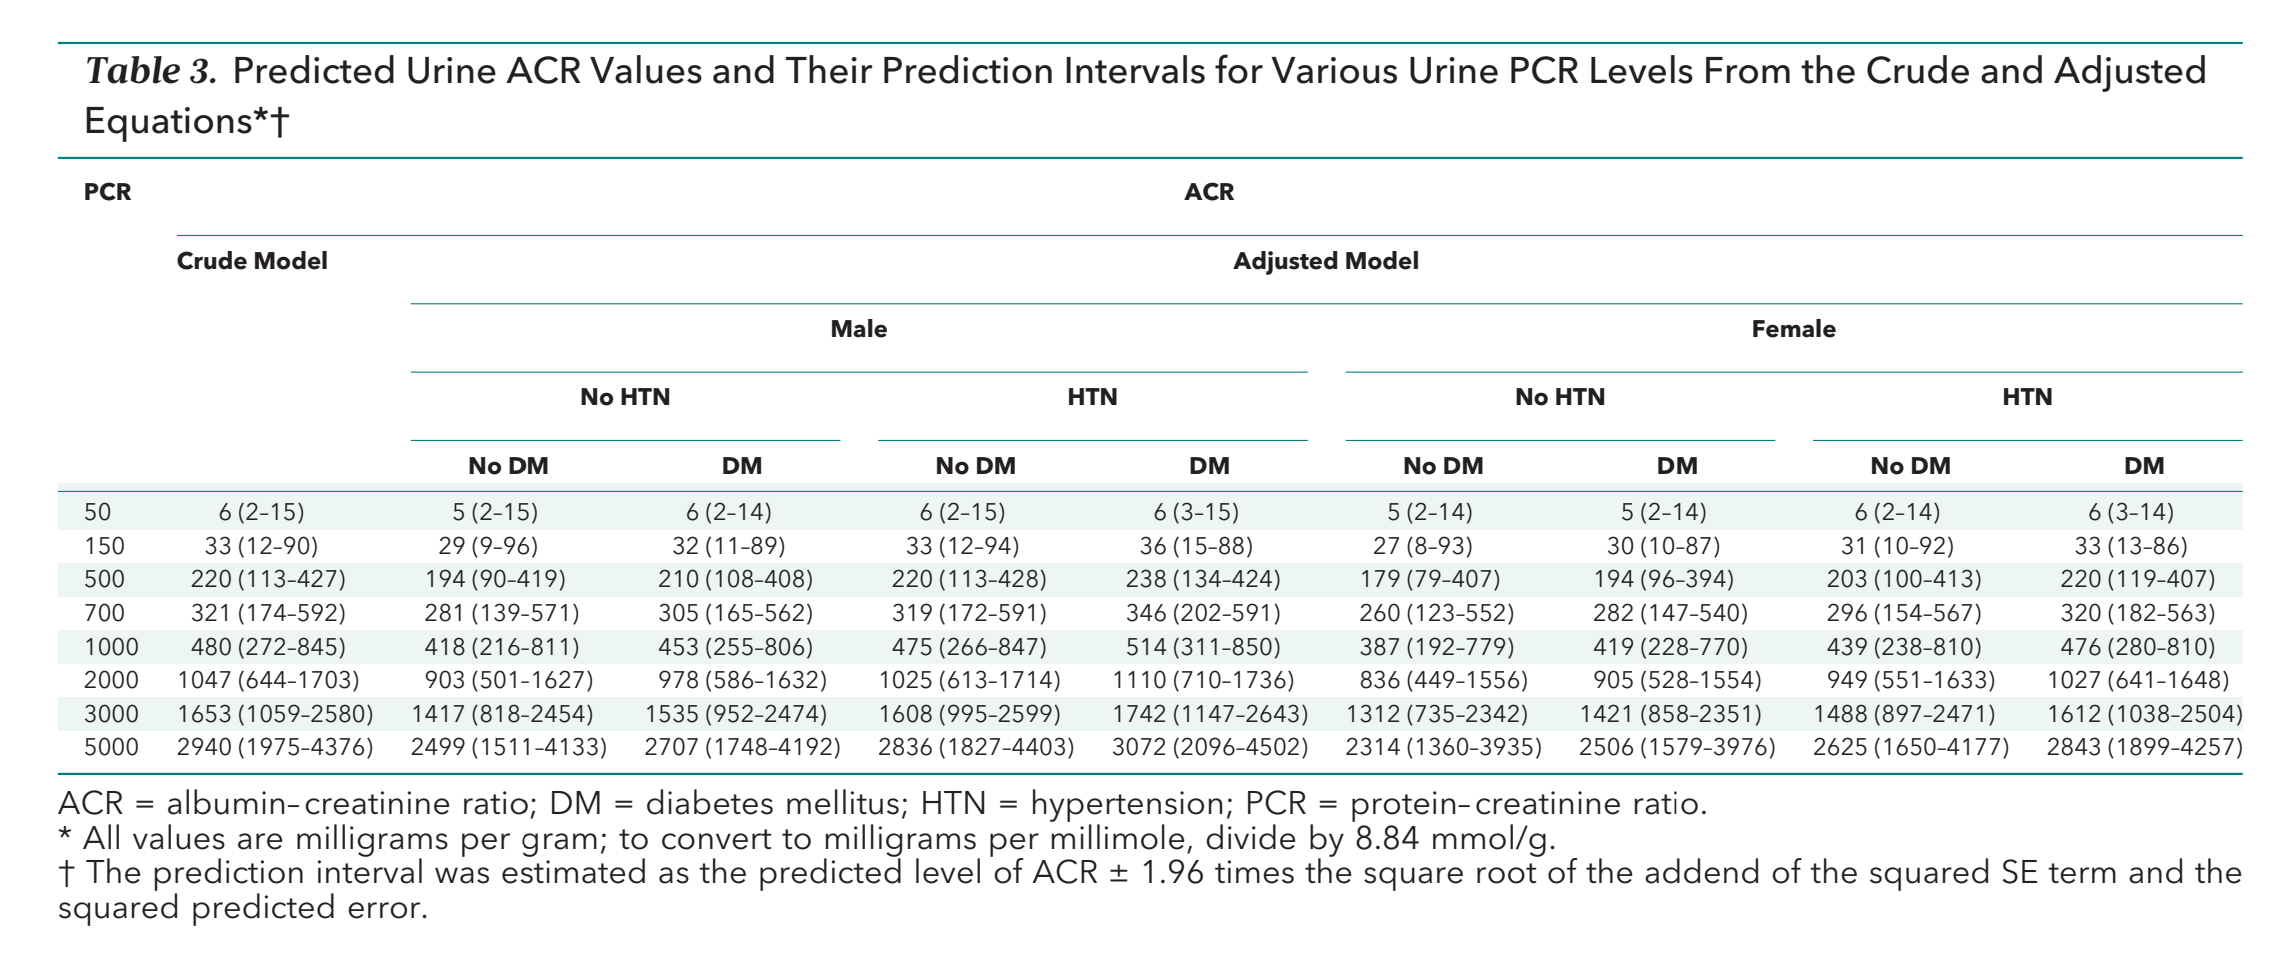
Table 3 from Sumida et al, Annals of IM 2020
Diagnostic Test Accuracy: Screening for CKD: The sensitivity and specificity of predicted ACR from PCR values for CKD screening, as defined by the detection of ACR ≥ 30mg/g, varied by cohort but were similar between crude and adjusted models. In the crude model, the PCR based equation was able to detect ACR ≥ 30mg/g or above with sensitivity and specificity of 91% (CI 87%-94%) and 87% (CI 81%-90%), respectively (Table 4). For urine protein dipstick, the sensitivity and specificity of detecting ACR ≥ 30mg/g were 62% (CI 51%-72%) and 88% (CI 83%-91%), respectively (Table 5).

Table 5 from Sumida et al, Annals of IM 2020
CKD staging: The sensitivity and specificity of the crude PCR predicted ACR detecting CKD stage A2 (ACR 30-299mg/g)were 75% (CI 71%-79%) and 87% (CI 86%-91%). The sensitivity and specificity were slightly higher for detecting CKD stage A3 (ACR ≥300mg/g) 87% (CI 84%-89%) and 98% (CI 96%-98%). Performance was similar with the adjusted equation (Table 4).

Table 4 from Sumida et al, Annals of IM 2020
The sensitivity and specificities were lower in the dipstick predicted ACR values of trace to +, detecting CKD stage A2. However, dipstick values of ++ demonstrated sensitivity and specificity of 78 (CI 72-83%) and 98% (CI 96%-99%) for A3 (Table 5).
CKD prognosis: The kidney failure risk estimates calculated by 2-year KFRE using predicted ACR compared with the 2-year KFRE using observed ACR were similar. In the crude model, the sensitivity and specificities were 96% and 99, respectively, in the OLDW cohorts and 81% and 99%, respectively, in cohorts that sent data to the Data Coordinating Center (Supplemental figure 5).
C-statistic for 2-year KFRE was 0.879 when observed ACR used, 0.883 when predicted ACR was used.
The investigators have developed a risk calculator based on these results, freely available here:
Discussion
This study sought to empirically develop equations converting PCR and urine protein dipstick to a ‘predicted ACR’ and assessed their diagnostic accuracy in CKD screening, staging and risk prediction. Crude and adjusted equations were developed for both PCR and urine protein dipstick; all of which corresponded well with KDIGO recommended threshold estimates of A2 (30mg/g-299mg/g) and A3 (≥300mg/g) with relatively small effects observed among combinations of sex, diabetes and hypertension in the adjusted model. For this reason, it was determined that the crude models were less complex yet still sufficient in predicting ACRs. However, PCR to ACR correlations did not hold true in PCR values < 50mg/g, where no correlation between PCR and ACR was observed. In PCR values ≥ 3000mg/g, corresponding ACRs correlated less reliably with the KDIGO recommended ACR value (≥ 2220mg/g).
Importantly, the equations derived from PCR conversion demonstrated moderate sensitivity and specificity for CKD screening and detecting A2 and A3 CKD stages. Consistent with previous studies, urine protein dipstick demonstrated low sensitivity and high specificity for CKD screening and CKD detection, however sensitivities were higher for urine protein dipsticks of ++ at detecting CKD stage A3. Finally, the 2-year KFRE risk using predicted ACR to observed ACRs was similar, inferring similar individualized risk for kidney failure between the two.
Except when the urine for PCR was <50mg/g or >3000mg/g, the PCR conversion equations demonstrated good agreement with current KDIGO ACR estimates. Furthermore, the PCR predicted ACR values performed well as screening, staging and prognostic tools for CKD. Despite ACR serving as the gold-standard in assessing and monitoring CKD, widespread implementation of ACR has been handicapped by financial and other clinical considerations. Utilizing conversion equations from less expensive and more widely available tests like PCR and urine protein dipstick offers a practical and potentially cost-effective method for CKD screening, staging and risk stratification, particularly in limited resource settings. Furthermore, the research implications are immense; for example, in large retrospective cohort studies, missing ACR data can potentially be estimated through the conversion of PCR and urine protein dipstick data.
The strengths of the study were the large sample size and the generalizability gained by the international collaborative meta-analysis representing diverse cohort populations.
The limitations of the study included the following: Pairs of PCR and ACR or dipstick and ACR labs were tested on the same day, but not always the same urine sample, providing for variability among correlating values. Laboratory collections occurred in different clinical settings utilizing different laboratory assays, contributing to variation. Furthermore, intra and inter-laboratory variation has been reported in current assays measuring urine protein. Despite this being a multinational, widely generalizable study, the black population remains underrepresented at only 4.8%. Finally, for PCR <50mg/g and ≥ 3000mg/g, conversion equations do not reliably reflect KDIGO ACR estimations.
CONCLUSION
Is the end of the primacy of albuminuria? At low levels, it does seem that PCR and ACR do not correlate well, though we don’t make individual patient level management decisions based on small differences at that level. Similarly, at very high levels, does it matter if the 7 g of proteinuria correspond to 5.5 or 4.8 g of albuminuria - all are very high and unlikely to change your management decisions. Hopefully the 24-hour issue is long settled (Rodby, AJKD 2016), and now PCR is next. Within patients it would make sense to remain consistent - and this gives reassurance to those clinicians without access to precise albuminuria measurements.