Am J Physiol Renal Physiol. 2026 May 1;330(5):F530-F540.doi: 10.1152/ajprenal.00049.2026. Epub 2026 Mar 26.
Increasing plasma sodium with Tolvaptan under regulated water intake: comparison with hypertonic saline
Nabil William Sweis, Jennifer Tuazon, Yusra Cheema, Robert Rosa, Daniel Batlle, Gary Robertson
Why is the present study needed?
Hyponatremia is highly prevalent and affects approximately 35% of hospitalized patients (Adrogue HJ et al, JAMA, 2022). Although there is still a great amount of debate, most clinicians believe the rate of correction is the primary issue in the treatment of hyponatremia. Slower correction increases the risk of brain herniation, while faster correction increases the risk of osmotic demyelination (ODS) in high risk persons. The serum osmolality is tightly regulated between 275 and 295 mOsm/kg by vasopressin, which acts on the V2 receptor in the collecting duct. This mechanism triggers the transport of aquaporins from the basolateral to the apical membrane, thereby increasing water absorption and concentrating urine. (Martinez-Sanchez FD, et al. World J Nephrol, 2026) .
Figure 1. The mechanism of sodium and water homeostasis from Martinez-Sanchez FD, World J Nephrol, 2026.
Vaptans increase serum sodium by blocking V₂ receptors, which causes aquaresis and improves serum sodium levels in a more physiological way; however, some articles report a risk of ODS with vaptans (Morris JH, et al. AJKD, 2018; Scalla AP, et al. J of Pharm Pract, 2024). A meta-analysis with 1840 patients with 3 RCTs and 2 cohorts, claimed a higher rate of correction with the vaptans compared to placebo and fluid restriction with an OR of 5.72 for overcorrection, with a pooled overcorrection incidence of 13.1% vs 3.3%, yet zero observed ODS events. (Krisanapan P et al. J Clin Med, 2023). Can we control the rate of correction with vaptans and use them to correct hyponatremia while avoiding overcorrection?
How was the study done?
The study included healthy volunteers by way of advertisement and was conducted at Northwestern Memorial Hospital in Chicago. Out of 17 volunteers, the first 6 received 60 mg of tolvaptan, and of the next 11 volunteers, 6 received 30 mg and completed the study; the remaining 5 were disqualified due to difficulty in voiding, dizziness while voiding, and alcoholic intoxication. The study was funded by Otsuka American Pharmaceuticals, the manufacturer of vaptans.
Figure 1. Schematic of regulated water intake from Sweis N, et al. Am J Physiol Renal Physiol, 2026
The selected subjects were admitted to the hospital at 7:00 am; their vitals, height, weight, and time of recent void were recorded. At 9:00 am, they were instructed to void into a preweighed plastic container, and urine volume was determined. The sample was measured for urine osmolality, and blood was collected for plasma osmolality and serum sodium. Another sample was stored at -20°C for vasopressin measurement by radioimmunoassay. After collecting basal data, the first six participants received 60mg of Tolvaptan and the next received 30 mg of tolvaptan they were instructed to take tolvaptan with 150 ml of water. Every hour, weight, urine osmolality, plasma osmolality, serum sodium, and vasopressin samples were collected. They were given room-temperature water to drink equal to the amount of urine volume (UV) in the previous hour, minus 5 ml/kg of body weight (underreplaced). After the 6 hours of regulated water intake, the subjects were advised to eat, drink, exercise, and sleep as they wished until the next day at 7 AM. The same measurements were taken at 2, 2, 4, and 8 hours.
Hypertonic saline infusion: After completing the tolvaptan study, the same participants were admitted 2 weeks later, and the same basic measures were taken as in the tolvaptan study. They were infused with hypertonic saline at 0.033 ml/kg body weight (approx. 2 ml/kg/h cumulative) over six hours with complete water restriction, and the same measurements were taken for the next 4 hours.
What did they find?
Tolvaptan 60mg group:
Initial 6 hrs of the regulated water intake phase:
Urine osmolality, urine volume, and free water clearance were monitored hourly.
Urine osmolality decreased from baseline 478 to 59 at the 3rd hour and gradually increased to 154 at the 6th hour.
Urine volume increased from 72 to 749 at the 3rd hour, then gradually decreased to 451 by the end of the 6th hour.
Supplemental Table 1A. Effect of tolvaptan in healthy males from Sweis N, et al. Am J Physiol Renal Physiol, 2026
Thirst: Thirst increased progressively from basal to the 6th hour of regulated water intake On a scale of 0 to 10, the individual ratings (mean ± SD) rose from a basal level of 2.0 ± 1.5 to a maximum of 5.8 ± 2.9 after 6 h of regulated water intake, and mean thirst rates were correlated with the plasma osmolality during the first 6 h of regulated water intake. (R = 0.8687, P < 0.05)
Water intake: At zero hour, all six consumed 150 ml of water, and after that, they consumed an amount equal to UOP for that hour, lessened by 5 ml/kg as calculated by the nurse in charge (controlled water intake).
Body weight: Since the amount of water intake was smaller than the amount excreted, the participants went into a negative water balance, which was also reflected in their body weight, decreasing from 71.8 ± 13.5 kg to 69.8 ± 13.2 kg after 6 h of regulated water intake. When adjusted for differences in body weights, individual losses over the 6 h of regulated intake were very similar, ranging from 2.7 to 3.4% of basal body weight.
.
Plasma osmolality and sodium: The decrease in body weight is closely correlated with the increase in plasma osmolality and plasma sodium during regulated water intake. Osmolality increased from 287 ± 1.6 to 300 ± 3.0 mosmol/kgH₂O, and sodium concentration increased from 138 ± 0.6 to 144 ± 2.0 mEq/L, respectively.
Vasopressin (AVP): The progressive rise in plasma osmolality and plasma sodium resulted in a progressive rise in vasopressin, and the osmotic threshold for vasopressin release was similar, ranging from 286 to 290 mosm/l.
Ad libitum water intake phase (1500 h - 700 h):
After 6 h of regulated water intake, all volunteers were permitted to eat and drink at will; this phase was divided into two parts, the first 8 h part and the second 8 h part.
First 8 h part: Urine osmolality and urine volume were maintained at the same level. But body weight increased, and plasma osmolality, sodium, and vasopressin declined about halfway back to basal pretreatment levels.
Last 8 h part: The subjects slept, water intake decreased dramatically, urine osmolality increased, and urine output decreased; however, plasma osmolality and plasma sodium continued to fall but remained above basal levels, and vasopressin rose slightly but remained well above basal levels the next morning.
Figure 2. Urine osmolality and volume, water intake, and plasma osmolality and sodium following Tolvaptan (60 mg) from Sweis N, et al. Am J Physiol Renal Physiol, 2026
Tolvaptan 30 mg group: Despite comparable peak PNa (~144 mEq/L in both groups), the percentage rise in POsm/PNa was smaller with 30 mg (3.3-3.6%) than 60 mg (4.1-4.3%), even though weight loss relative to body mass was nearly identical between groups (~2.8% in both). Using the paper’s own free-water model (TBW-57% of body weight), the observed weight loss in both groups should have produced a ~4.9% rise in POsm/PNa; the actual rise fell short in both, and more so in the 30 mg group.
Figure 5. Urine osmolality and volume, water intake, and plasma osmolality and sodium following Tolvaptan (30 mg) from Sweis N, et al. Am J Physiol Renal Physiol, 2026
3% Hypertonic saline infusion:
After 10-14 days following the tolvaptan study, the same subjects were infused with IV hypertonic saline (3%) for 6 h at a rate of 0.033 ml/kg/hr; during the infusion they were not allowed to drink, and the same variables were measured.
Urine osmolality and body weight increased, and urine volume also increased, but not to the same level as after tolvaptan. Plasma osmolality, plasma sodium, and thirst also rose similarly to tolvaptan. Even vasopressin levels rose, but not to the same extent as in the tolvaptan study.
After hypertonic infusion stoppage, the individuals were allowed to eat and drink at will for 4 hours. At that time, urine osmolality and volume did not change, but plasma osmolality and plasma sodium were decreased by half of the values during the infusion. Vasopressin levels decreased to baseline levels.
Supplemental Figure 1B. Effect of 3% saline infusion on water balance in healthy males from Sweis N, et al. Am J Physiol Renal Physiol, 2026
Comparison of the Effects of Tolvaptan and Hypertonic (3%) Saline Infusion
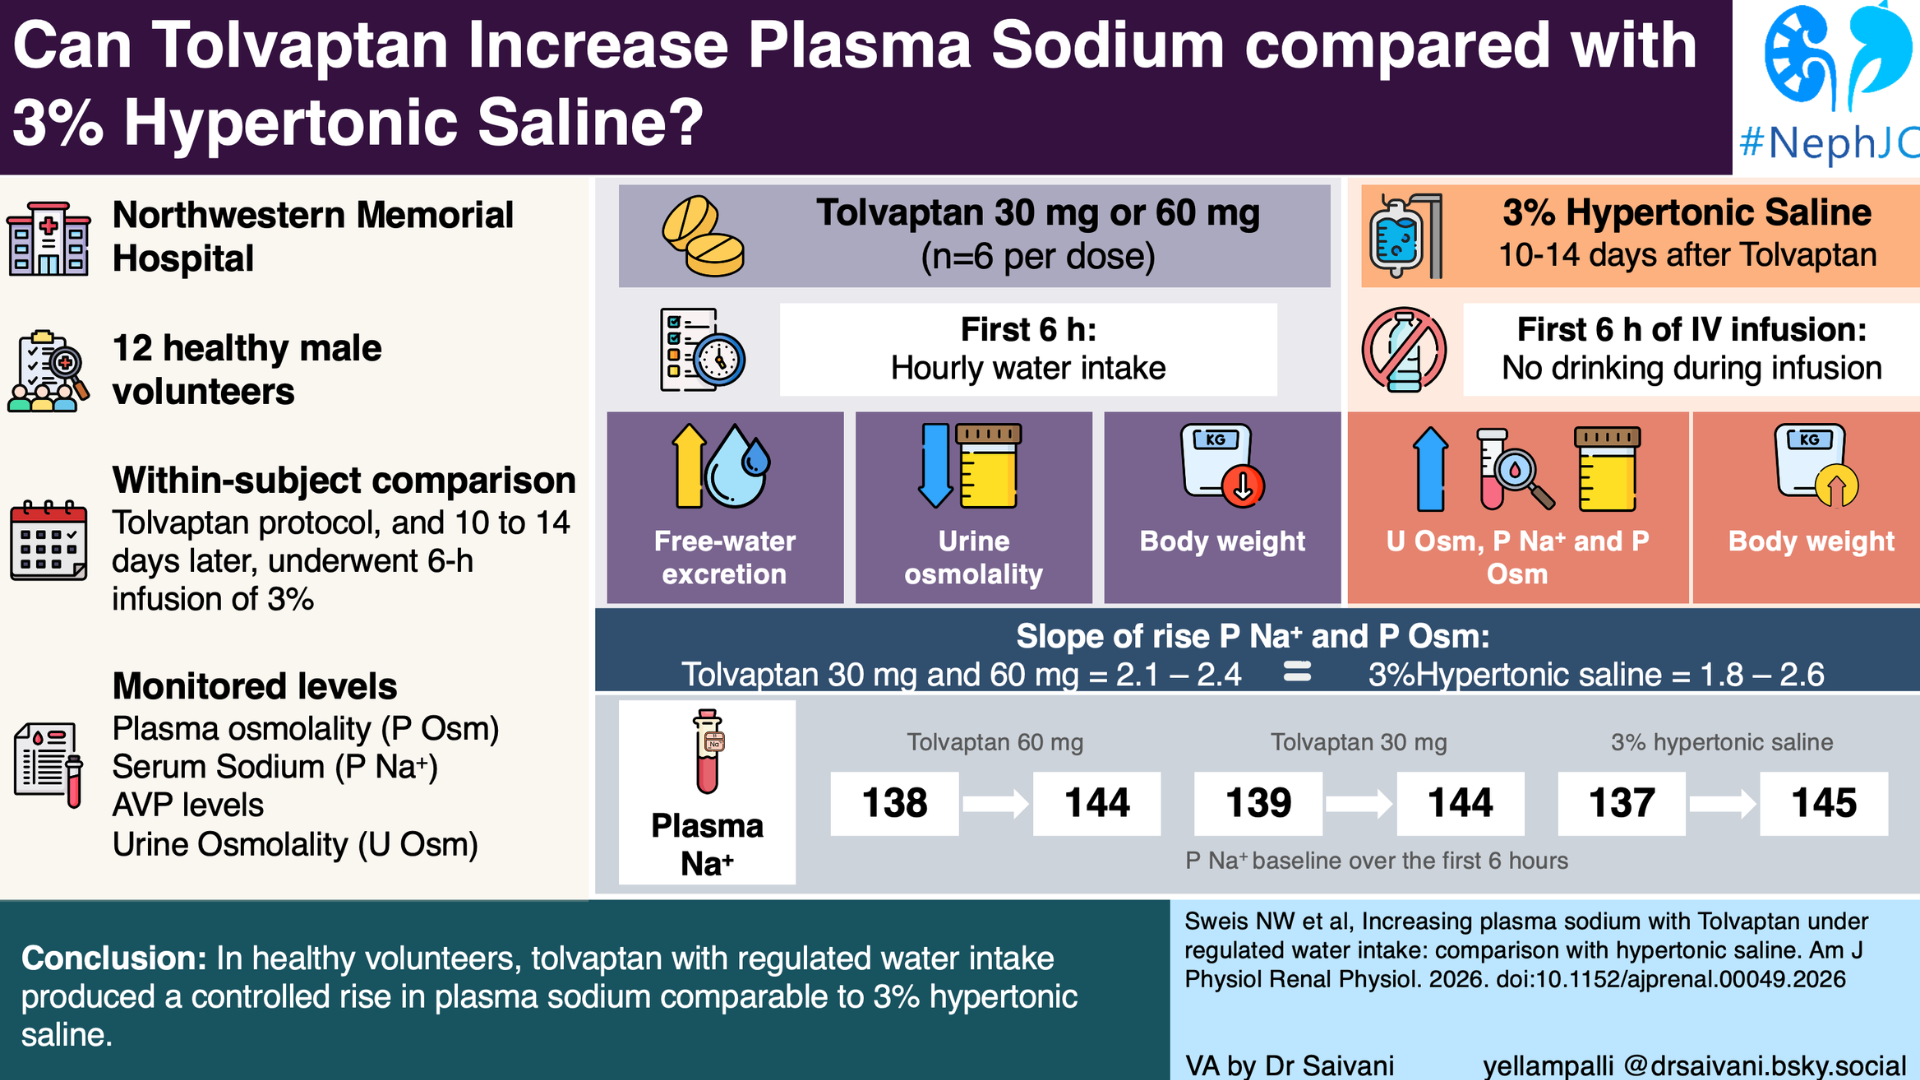
The slopes of changes in plasma sodium and plasma osmolality after each dose of Tolvaptan (60 or 30 mg) are 2.1 to 2.4, while those after hypertonic (3%) saline infusion are 1.8 to 2.6, and both are similar. However, the slope of the rise in plasma AVP after Tolvaptan 30 and 60 mg is twice that of the rise with 3% saline.
Figure 6. Plasma sodium, plasma osmolality, and plasma arginine vasopressin (AVP) after Tolvaptan 60 mg and 30 mg as compared with 3% saline infusion from Sweis N, et al. Am J Physiol Renal Physiol, 2026
There was a high correlation between plasma osmolality and plasma AVP levels for all three treatments: tolvaptan 60 mg, tolvaptan 30 mg, and 3% NS in all 3 groups, with an r value above 0.9 and a p value < 0.001, how ever in each of the 6 subjects in whom plasma AVP was measured, it rose in close correlation with plasma osmolality during treatment with tolvaptan when fluid intake was regulated (r=0.9736) as well as when it was not (r=0.9360). A similar correlation was observed during the infusion of hypertonic saline when fluid intake was not permitted (r=0.9637) as well as when it was (r=0.9360). However, the slopes of the relationships between plasma AVP and plasma osmolality differed appreciably not only as a result of the two different treatments but also between subjects during each treatment.
Supplemental Table 3A. Relationship of AVP to plasma osmolarity from Sweis N, et al. Am J Physiol Renal Physiol, 2026
Critical Review
How can this study impact our practice? Can we use tolvaptan in chronic hyponatremia without the fear of ODS?
Although a recent meta-analysis (Ayus J, et al. JAMA Intern Med, 2025) suggested that slow and very slow sodium correction are associated with increased risk of mortality and longer length of hospital stay compared to rapid correction, guidelines have not changed regarding the rate of correction, as the meta-analysis was based on observational cohorts and not RCTs.
The present study supports the hypothesis that the rise in plasma osmolality and sodium under regulated water intake can be controlled with tolvaptan intake. Though tolvaptan produced thirst, it did not correlate with the magnitude of increase in urine output, but showed a strong correlation between body weight decline and rise in plasma osmolality and sodium where water intake was not regulated by thirst but by under-replaced urine output.
In the initial 8 hrs of unrestricted water intake, plasma osmolality and sodium continued to decline about halfway back to basal pretreatment levels, even though they continued to excrete abnormally large volumes of dilute urine, suggesting that vaptans with normal water intake may not increase plasma sodium levels. In the next 8 hrs, when the subjects were sleeping, their intake was reduced, and the urine osmolality increased.
Strengths:
The study explained the impact of vaptans with regulated fluid intake and when given ad libitum fluid intake. The study showed that regulated fluid intake in healthy males resulted in a similar correction of plasma osmolality as per the guidelines.
Limitations:
1) The study was performed only in males.
2) The study was conducted only in healthy subjects whose kidneys and water regulatory systems would not allow them to experience serious side effects, but how practical is it for patients with already damaged water regulatory systems? This is especially true for patients who are more prone to ODS during correction, such as those with chronic alcoholism, malnutrition, or hypokalemia.
3) This treatment cannot be given on an outpatient basis because hourly measurement of urine output and adequately replacing that output is practically impossible, so it requires ICU management.
4) It was not a safety study: no ODS-relevant endpoints were assessed, and the absence of adverse events beyond thirst does not constitute a safety evaluation.
5) Duration mismatch with clinical practice: the regulated phase was 6 h; the Na rise it produced (5-6 mEq/l) largely reversed overnight once ad lib intake resumed. Real hyponatremia correction is a multi-day process. What’s untested is whether a fixed per-hour deficit sustained over 24-48 h (vs a single 6 h burst) produces the same predictability or compounds error.
6) The unresolved TBW-model shortfall (predicted 4.9% rise vs. observed 3.3-4.4%) means the underlying free-water deficit arithmetic (the basis of the 5 mL/kg/h prescription itself) is an approximation, not a validated dosing formula.
Conclusions:
The authors have demonstrated that tolvaptan, when combined with regulated water intake, has a rate of sodium rise similar to 3% NS infusion in normal healthy males. Further studies in a broader population of hospitalized patients with hyponatremia are needed to prove the efficacy of tolvaptan at the bedside and to support its wider use in hyponatremia.