
#NephJC Chat
Tuesday July 24 9 pm Eastern
Wednesday July 25 8 pm BST, 12 noon Pacific
JAMA. 2018 May 8;319(18):1870-1879. doi: 10.1001/jama.2018.4930.
Effect of Coaching to Increase Water Intake on Kidney Function Decline in Adults With Chronic Kidney Disease: The CKD WIT Randomized Clinical Trial.
Clark WF, Sontrop JM, Huang SH, Gallo K, Moist L, House AA, Cuerden MS1 Weir MA, Bagga A, Brimble S, Burke A, Muirhead N, Pandeya S, Garg AX.
PMID: 29801012 Full Text at JAMA


Introduction
I instruct my patients to drink lots of fluids (not exactly water), especially the elderly, during summer, and patients from upper Egypt, where it can get extremely hot. It is also an important issue while discussing Ramadan fasting with CKD patients (fasting requires the abstinence from drink from dawn to sunset daily for 30 consecutive days). I instruct those who fast to drink 3 liters after sunset till dawn again.
Despite the fact that world kidney day in 2015 encouraged people to drink more water as "it may protect their kidneys", little data exist about the effect of hydration on CKD progression. Increased fluid intake has a proven benefit in secondary stone prevention (summarized in this review). It is now being investigated in 2 RCTs (PREVENT-ADPKD and DRINK trials) in halting cyst growth and delay progression of ADPKD through Vasopressin suppression (implicated in cyst growth). But a benefit in CKD patients is still unclear.
Nevertheless, interest is growing to explore and expand the knowledge about the effect of hydration on kidney health. For example, the ISN created the Hydration for Kidney Health (H4KH) Research Initiative (funded by Danone) to focus on this area.
The CKD WIT trial formulated a very specific research question:
“Does drinking more water protect against declining kidney function in patients with CKD stage 3?”
The Study
Methods
Rationale:
The study is based on previous study of healthy adults free of CKD, those with urine volumes of 3 L per day or more had a significantly slower eGFR decline than those with smaller urine volumes (difference, 0.6 mL/min per 1.73 m2 per year; P = .01).
Design:
A parallel-group RCT was conducted from April 2013 to June 2017 in Ontario, Canada.
Inclusion criteria:
The study population was
adult CKD stage 3 patients
Proteinuria:
Woman: albumin-to-creatinine ratio ≥ 25 mg/g (2.8 mg/mmol)
Men: albumin-to-creatinine ratio ≥ 18 mg/g (2.0 mg/mmol)
Trace protein or greater from a urine dipstick
Exclusion criteria:
self-reported fluid intake of 10 cups per day or more
24-hour urine volume of 3 L or more
history of kidney stones in the past 5 years
currently taking lithium or a diuretic (above a certain dose)
a prescribed fluid restriction of less than 1.5 L per day
Sample Size
A prespecified 1 ml/min per 1.73 m2 was chosen as a minimally important difference, which gave a target sample of 700 patients (350 per group; assuming a SD of <5; 2-sided α = .05; power 80%). Recruitment was stopped before 700 patients were enrolled due to budget issues. However, with 630 patients and a 1.3-year delay provided enough study power to detect a larger difference of 2 ml/min per 1.73 m2.
A 2 ml/min GFR difference should be looked at in the context of the fact that patients with CKD have a mean decline in eGFR from 1.5 to 3.5 mL/min per 1.73 m2 per year.
Intervention:
Patients in the hydration group were coached to increase their water intake by 1.0 to 1.5 L per day over and above usual consumed beverages, for the duration of the 1-year trial.
Patients in the control group were coached to continue with their usual fluid intake or to decrease intake by 0.25 to 0.5 L per day (1 to 2 cups/d) if their pre-randomization 24-hour urine volume was greater than 1.5 L per day and 24-hour urine osmolality was less than 500 mOsm/kg.
Adherence was assessed and encouraged by:
individual coaching phone calls
discussion of urine color charts
24-hour urine volume at 6 and 12 months
self-reported fluid intake measured at 3, 6, and 9 months
Randomization and blinding:
After randomization, research staff and patients were made aware of group assignment; however, the primary outcome was an objective measure, outcome assessors and the trial statistician were blinded to patient allocation.
Outcomes and Analysis:
The primary outcome was 1-year change in eGFR.
Secondary outcomes were 1-year change in plasma copeptin concentration, creatinine clearance, 24-hour urine albumin and patient-reported overall quality of health.
Role of Funding Source:
The study was funded by Danone (maker of bottled water, and funder of the ISN H4KH initiative). Apart from asking for copeptin and creatinine clearance as secondary outcomes. they did not have any role in conduct or analysis.
Results
2390 patients assessed for eligibility, 822 patients consented, of those 631 patients were randomized to the hydration group (n = 316) or the control group (n = 315). During the 1-year trial period, 12 of 631 patients died (1.9%) (5 [1.6%] in the hydration group and 7 [2.2%] in the control group); of the 619 survivors, 95% provided 1-year follow-up measurements (see figure 1 for details).
There were no baseline clinically important differences between randomized groups. Adherence to intervention was ensured by detecting a mean 1-year change in 24-hour urine volume. This worked out to
24-hour urine volume was 0.6 L per day greater in the hydration group (95% CI, 0.5 to 0.7; p < .001) than the control group
Self-reported fluid intake was 0.7 L per day greater in the hydration group (95% CI, 0.6 to 0.8; p < .001) than the control group

Table 2 from Clark et al, JAMA 2018
Primary outcome was negative. The mean 1-year decline in eGFR was −2.2 mL/min per 1.73m2 in the hydration group and −1.9 mL/min per 1.73m2 in the control group; the adjusted between-group difference in change was−0.3 mL/min per 1.73m2 (95% CI, −1.8 to 1.2; p = .74).
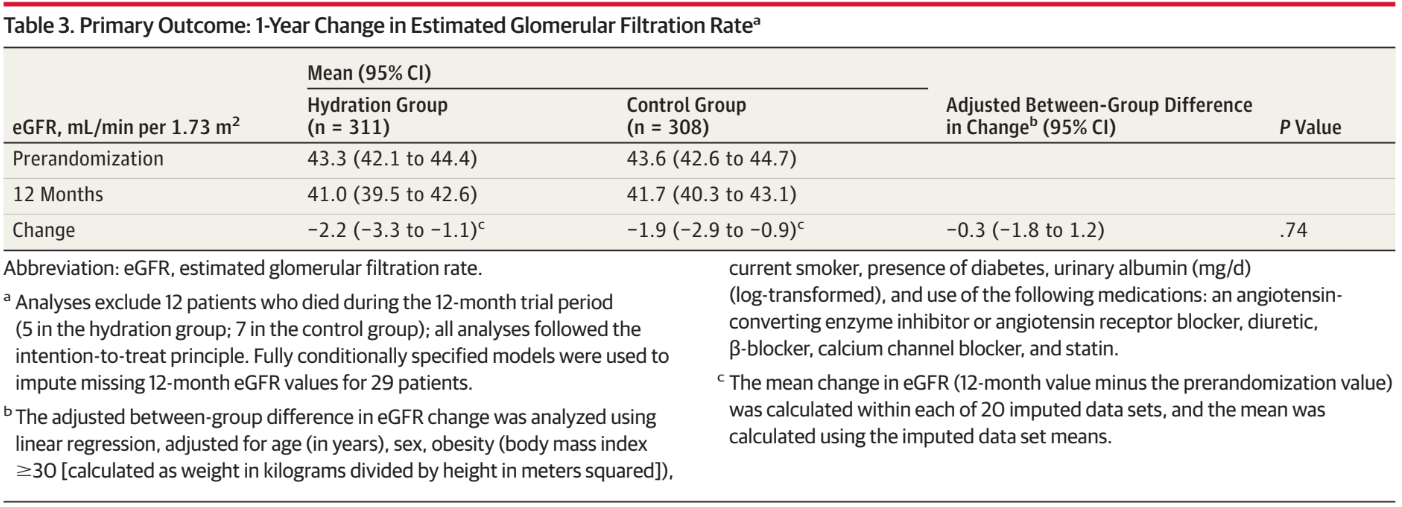
Table 3 from Clark et al, JAMA 2018
Results were similar in the unadjusted analysis and when eGFR was calculated using cystatin C, and when eGFR change was analyzed longitudinally.
Subgroups
No statistically significant interactions were observed in 3 post hoc subgroup analyses of patients with and without macroalbuminuria or diabetes and in those with an eGFR of at least 45 mL/min per 1.73 m2 or less than 45 mL/min per 1.73 m2 at baseline.
Secondary outcomes:
Statistically significant between-group differences were seen for plasma copeptin concentration and creatinine clearance but not for 24-hour urine albumin or patient-reported quality of health.
Serum sodium concentration declined to less than 130 mEq/L in 3 patients in the hydration group and in 1 participant in the control group. Each case was investigated and reported to the participant’s physician; all values normalized by the next study visit.
Discussion
In this trial, coaching patients to increase water intake didn't slow the decline in eGFR (using serum Creatinine and Cystatin-C based CKD-EPI equations) over 1 year, but did decrease plasma copeptin.
Strengths:
This is the first RCT testing the effect of increased water intake versus usual water intake to slow the decline in eGFR in CKD patients. Adherence to the group randomization was ensured by measuring the mean 1-year change in 24-hour urine volume, plasma copeptin and self-reported fluid intake.
The absence of significant effect was explained by the authors in several ways:
Drinking more water doesn't protect against declining kidney functions;(WKF) and previous observations were confounded.
There may be an effect, but the study was not powered enough to detect it.
A greater difference in water intake is needed to produce a measurable effect on eGFR.
More than 1 year of follow-up is needed to detect an effect on eGFR.
Findings needing attention:
1-year decline in eGFR was slightly greater in the hydration group, suggesting a possible effect in the opposite direction.
A marked incongruence was observed between the 1-year change in eGFR and creatinine clearance. The between group difference in the 1-year change in GFR estimated with serum creatinine was −0.3 mL/min per 1.73m2 and with serum cystatin C was -0.2 mL/min per 1.73m2 (p > .05); however, the 1-year change in creatinine clearance was significantly higher in the hydration group relative to the control group (the between-group difference was 3.5 mL/min per 1.73 m2 [P = .01]). This was again explained by the authors as being attributed may be to urine collection error, increase intake of protein and sodium in the hydration group or increased tubular secretion of creatinine with increased urinary flow rate.
Limitations
Despite the strict regulations to follow patients, mean urine volume in the hydration group increased by only 0.6 L per day relative to the control group. A difference that is too little to have a great impact on GFR.
Also, the study was restricted to white patients in Southwestern Ontario, Canada (a northern region with a temperate climate).
Finally, the use of eGFR instead of measured GFR may also impact the results.
Other thoughts:
What about advanced CKD patients with stage 4 CKD? Dr. Sandra Wagner is conducting a study, Association of water intake with osmolarity and renal outcome in patients with CKD stage 3-4, to test this.
Until there is more data in patients more similar to the ones that I treat, I think I will continue to instruct my patients to drink more fluids for their kidneys.
Summary by Mohamed E. Elrggal, Nephrologist, Alexandria, Egypt
NSMC Intern, Class of 2018